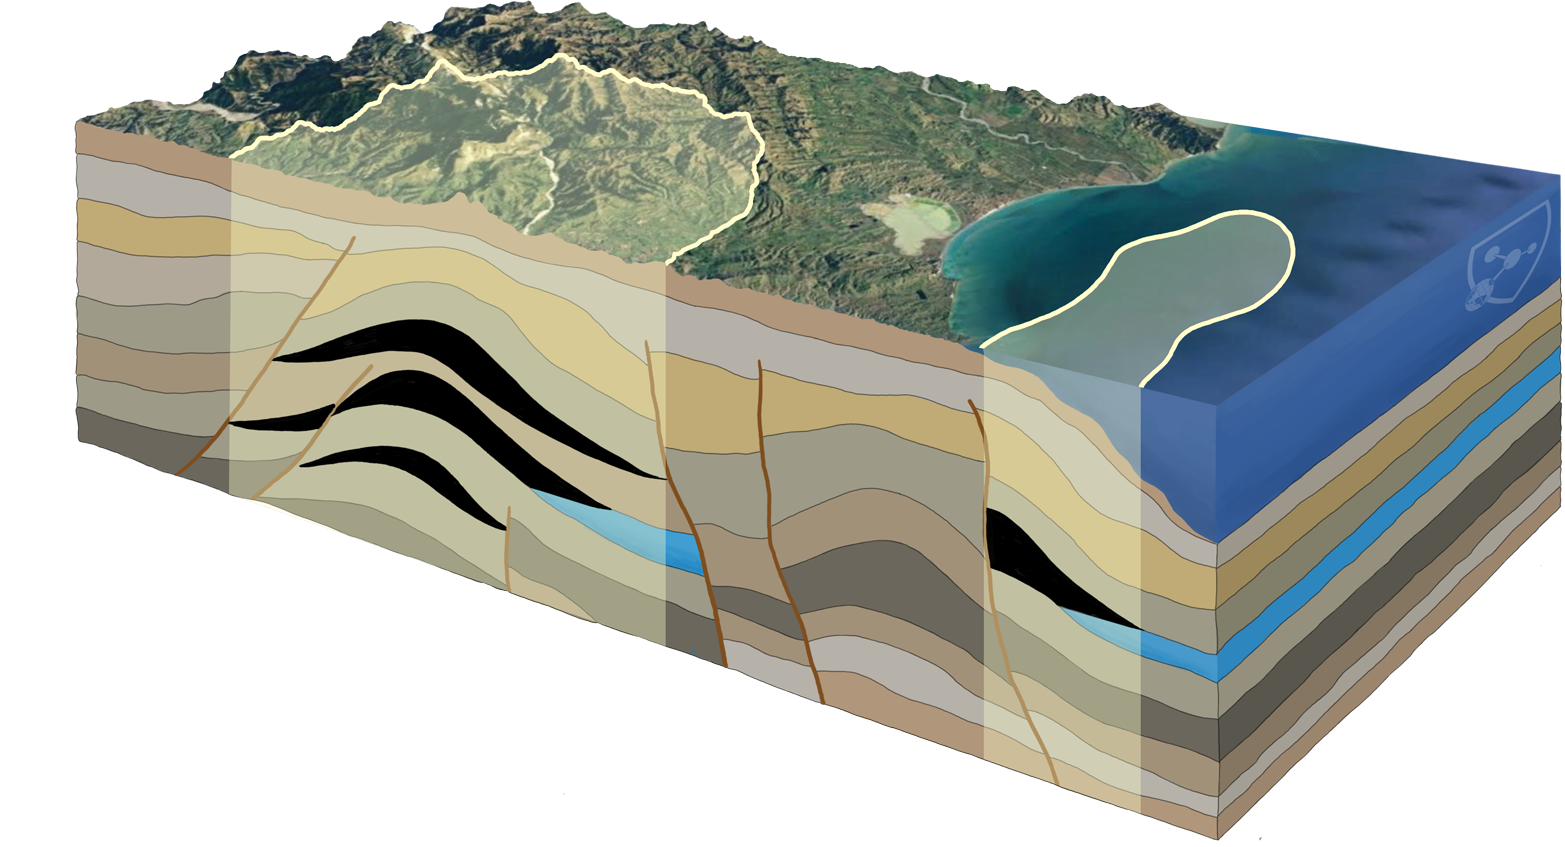
GeoResonance technology is based on the fundamental principle that all physical objects possess unique properties of energy. In the Earth's crust, all elements exist in an excited state, emitting intrinsic electromagnetic radiation with distinct amplitude, frequency, and phase. This radiation serves as a "fingerprint" for each element, allowing GeoResonance to identify and locate specific materials with great accuracy.
As various lithologic units possess unique atomic structures, the electromagnetic field generated by each unit has distinct properties. These fields overlap with those produced by other lithologic units, resulting in a stacked electromagnetic field across the surface of the Earth. This field contains the overlapped electromagnetic fields from various lithologies at any given point on the surface.
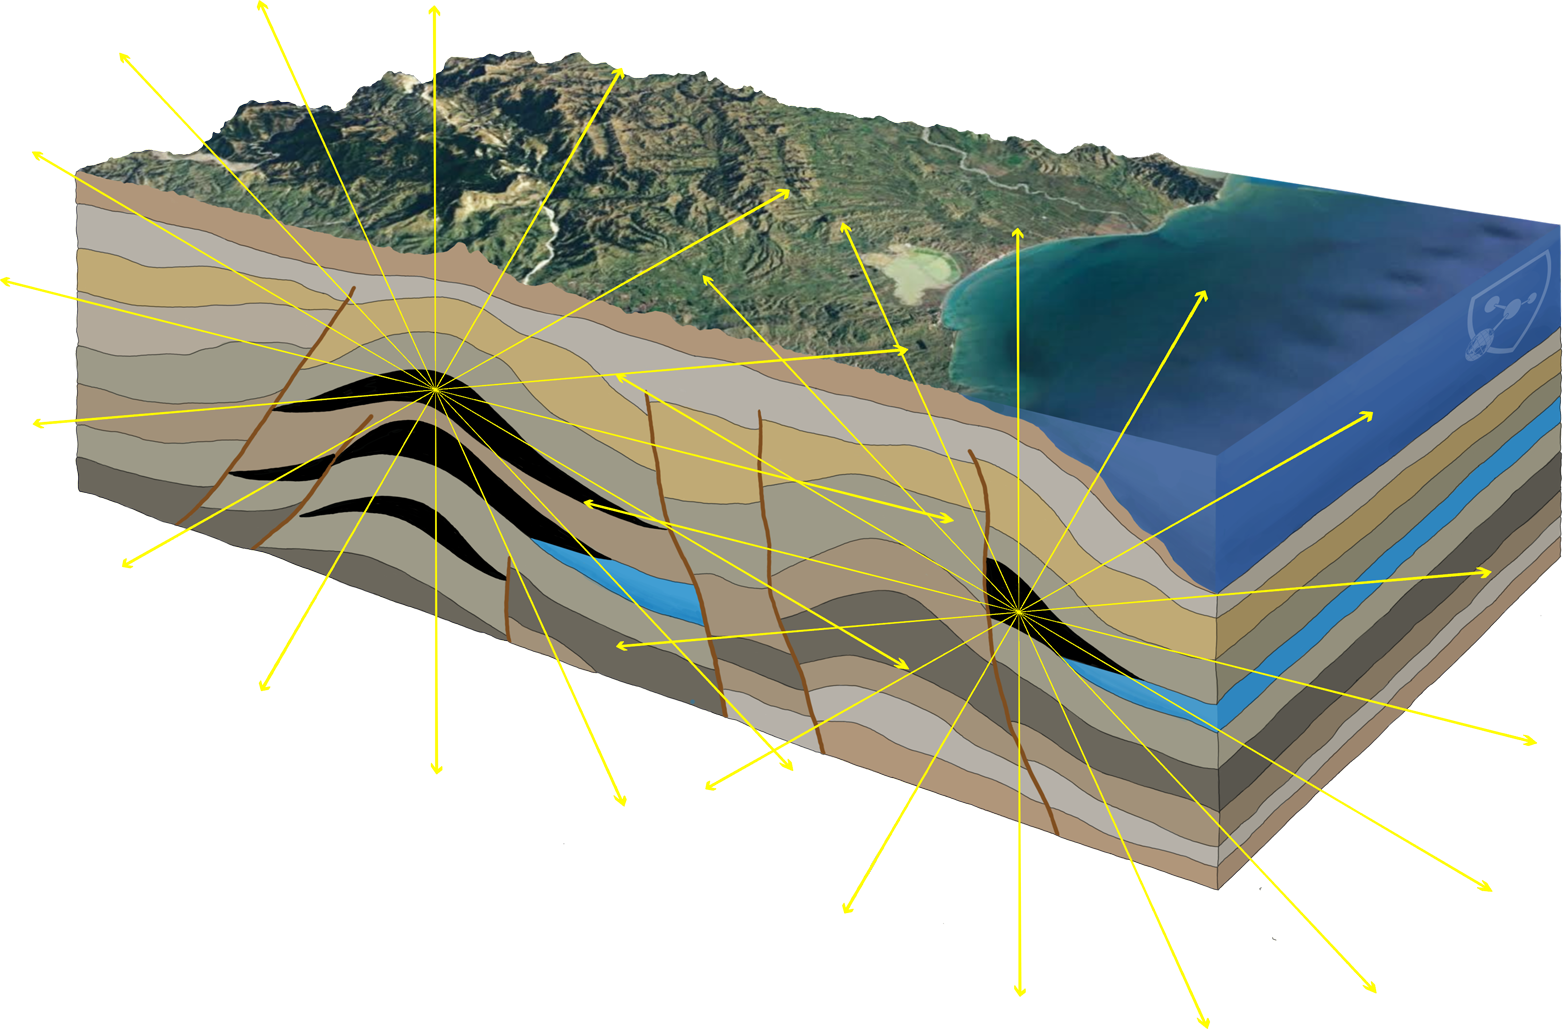
That electromagnetic radiation can be captured by Remote Sensing systems from above the surface. The captured electromagnetic information can then be analysed to filter out the EM field(s) generated by the substance of interest.
GeoResonance Remote Sensing methodology makes use of over 20 technologies. Some of the key enabling technologies are:
An On-Site Survey follows the GeoResonance Remote Sensing stage, to take the accuracy of geophysical findings to the next level.
Main key enabling technologies used by GeoResonance On-Site Survey methodology are:
REPORTED PARAMETER | REMOTE SENSING | On-SITE SURVEY |
| Survey objective | Regional reconnaissance, with the objective to identify anomalous zones of hydrocarbons that have significant footprints; or Detailed reconnaissance of hydrocarbon prospects, with the objective to determine their qualitative characteristics. | Detailed surface study, to measure quantitative characteristics of each hydrocarbon prospect and prepare data sets for subsequent drilling. |
| Study area | Any size. Anywhere. Onshore or offshore | Onshore or offshore[1] |
| Identification of hydrocarbons | Direct, by Spectral Signatures | Direct, by Spectral Signatures |
| Sensing depths | 5,500 m (18,000 ft) | 5,000 - 6,000 m (16,000 - 19,000 ft) |
| Object of study | Deposit Type Anomaly[2] (DTA) of hydrocarbons | Deposit Type Anomalies of hydrocarbons |
| Resolution (scale) of study | 1:10,000 – 1:100,000 | 1:500 – 1:5,000 |
| DTA contours | Reported | Reported |
| DTA area size | Reported | Reported |
| Effective DTA[3] | Reported | Reported |
| Intensity of anomalous signals | Reported | Reported at Measurement Points |
| Number of hydrocarbon-bearing horizons | Reported at Test Points | Reported at Measurement Points |
| Occurrence depths[4] of hydrocarbon-bearing horizons | True Vertical Depths reported at Test Points | True Vertical Depths reported at Measurement Points |
| Thickness of each hydrocarbon-bearing horizon | Reported at Test Points | Reported at Measurement Points |
| Hydrocarbon type (oil, gas, gas condensate) in each hydrocarbon-bearing horizon | Reported at Test Points | Reported at Measurement Points |
| Reservoir rock type[5] in each horizon | Reported at Test Points | Reported at Measurement Points |
| Reservoir pressure | Reported | Reported at Measurement Points |
| Oil-water contact, gas-water contact | Reported at Test Points | Reported at Measurement Points |
| Virtual Boreholes | N/A | Reported at Measurement Points |
| Modelling of deposit cross-sections | Reported | Reported |
| Hydrocarbon traps | Reported | Reported |
| Geomorphology, geological faults | Reported | Reported |
| Distribution of volumes of hydrocarbons within DTAs | N/A | Reported |
| Estimation of Petroleum-Initially-In-Place (PIIP) | N/A | Reported |
| Recommendations for the locations of 2D seismic lines, further exploration. and drilling | Reported | Reported |
| Selection of a location for drilling of an exploration well | N/A | Reported |
| Reports and maps | Yes | Yes |
CAPABILITIES | GEORESONANCE | SEISMIC |
| Measured parameter | Resonant magnetic fields produced by nuclei of the targeted hydrocarbons | Travel times of reflected seismic waves |
| Typical source of anomaly | Nuclei of the targeted hydrocarbons | Structures or velocity layer contrasts |
| Direct identification of hydrocarbons | Yes | No |
| Identification of structural traps | Yes | Yes |
| Identification of non-structural traps | Yes | No |
| Decision-ready data reported | Yes | No, data requires interpretation |
| Identification of hydrocarbon type: oil, gas, gas condensate | Yes | No |
| Estimation of occurrence depths of hydrocarbon-bearing horizons | Yes | No, depths of structural elements are reported |
| Identification of gas caps | Yes | No |
| Estimation of reservoir pressure | Yes | No |
| Identification of oil-water and gas-water contacts | Yes | No |
| Measurement of “Virtual Boreholes” | Yes | No |
| Estimation of probable petroleum initially-in place | Yes | Yes |
| Selection of locations for drilling sites | Yes | Yes |
| Average number of drillings prior to a discovery of a hydrocarbon deposit | 1 - 2 | 4 - 6 |
| Survey in any climate and geological conditions | Yes | No |
| Environmental impact | No, zero impact | There are environmental issues |
| Large-scale investigations | Yes, GeoResonance Remote Sensing | No |
| Survey duration (~ 1,000 km2) | 8 – 24 weeks | 2+ years |
| Survey cost | Negotiable | 2D: $1,000 to $5,000 per linear km. 3D: $10,000 to $50,000 per square km. |
REPORTED PARAMETER | REMOTE SENSING | On-SITE SURVEY |
| Survey objective | Regional reconnaissance, with the objective to identify anomalous zones of mineralisation that have significant footprints; or Detailed reconnaissance of mineralisation prospects, with the objective to determine their qualitative characteristics. | Detailed surface study, to measure quantitative characteristics of each mineral prospect and prepare data sets for a subsequent sampling/drilling program. |
| Study area | Any size. Anywhere. Onshore or offshore | Onshore or offshore [1] |
| Identification of mineralisation zones | Direct, by Spectral Signatures | Direct, by Spectral Signatures |
| Sensing depths | 1,000 - 1,500 m (3,300 - 5,000 ft) | 1,500 m (5,000 ft) |
| Object of study | Deposit Type Anomaly [2] (DTA) of targeted mineralisation | DTA of targeted mineralisation |
| Resolution (scale) of study | 1:2,000 – 1:50,000 | 1:500 – 1:2,000 |
| DTA contours | Reported | Reported |
| DTA area size | Reported | Reported |
| Effective DTA[3] | Reported | Reported |
| Intensity of anomalous signals | Reported | Reported at Measurement Points |
| Number of subsurface mineralisation zones | Reported at Test Points | Reported at Measurement Points |
| Occurrence depths[4] of mineralisation zones | Reported at Test Points | Reported at Measurement Points |
| Thickness of each mineralisation zones | Reported at Test Points | Reported at Measurement Points |
| Groundwater contact | Reported at Test Points | Reported at Measurement Points |
| Virtual Boreholes | N/A | Reported at Measurement Points |
| Anomaly cross-sections | Reported | Reported |
| Geomorphology, geological faults | Reported | Reported |
| Distribution of mineralisation volumes within DTAs | N/A | Reported |
| Estimation of in-place resources | N/A | Reported |
| Recommendations for geological sampling | Reported | Reported |
| Selection of location for drilling of exploration wells | N/A | Reported |
| Reports and maps | Yes | Yes |
REPORTED PARAMETER | REMOTE SENSING | On-SITE SURVEY |
| Survey objective | Regional reconnaissance, with the objective to identify anomalous zones of groundwater that have significant footprints; or Detailed reconnaissance of groundwater prospects, with the objective to determine their qualitative characteristics. | Detailed surface study, to measure quantitative characteristics of each aquifer prospect and prepare data sets for subsequent drilling. |
| Study area | Any size. Anywhere. Onshore or offshore. | Onshore[1] |
| Identification of groundwater | Direct, by Spectral Signatures | Direct, by Spectral Signatures |
| Sensing depths | 1,500 m (5,000 ft) | 4,000 m (13,000 ft) |
| Object of study | Deposit Type Anomaly[2] (DTA) of groundwater | DTA of groundwater |
| Resolution (scale) of study | 1:5,000 – 1:150,000 | 1:500 – 1:5,000 |
| DTA contours | Reported | Reported |
| DTA area size | Reported | Reported |
| Effective DTA[3] | Reported | Reported |
| Intensity of anomalous signals | Reported | Reported at Measurement Points |
| Number of groundwater-bearing horizons | Reported at Test Points | Reported at Measurement Points |
| Occurrence depths[4] of groundwater-bearing horizons | Reported at Test Points | Reported at Measurement Points |
| Thickness of each groundwater-bearing horizon | Reported at Test Points | Reported at Measurement Points |
| Groundwater type (fresh, salt, geothermal) in each horizon | Reported at Test Points | Reported at Measurement Points |
| Reservoir rock type[5] in each horizon | Reported at Test Points | Reported at Measurement Points |
| Groundwater temperature | Reported | Reported at Measurement Points |
| Direction of migration | Reported | Reported |
| Virtual Boreholes | N/A | Reported at Measurement Points |
| Modelling of aquifer cross-sections | Reported | Reported |
| Geomorphology, geological faults | Reported | Reported |
| Geothermal anomalies | Reported | Reported |
| Estimation of groundwater resources | N/A | Reported |
| Recommendations for drilling | Reported | Reported |
| Selection of a location for drilling an exploration well | N/A | Reported |
| Reports and maps | Yes | Yes |